The Middle Is Empty
Why the AI capex debate is asking the wrong question about the right number


In my second Post on the AI Bubble/Hype topic I argued that such bubble is best understood as a single object: the fidelity gap F between the world the industry claims and the world the industry is actually building. F has four axes. F_I (scaling), F_II (accounting), F_III (architecture), F_IV (benchmark).
This post extends F in a direction I did not anticipate when I wrote Post 2, and which I now think is the most important. The four axes I described in Post 2 are gaps between claimed and actual values of scalar quantities. There is a fifth gap, structurally different from the four, and it has now grown large enough to be measurable. I will call it F_shape.
F_shape is the gap between the shape of the distribution the market is implicitly pricing for AI capex returns, and the shape of the distribution the underlying dynamics actually produce. The first four axes are about where the central tendency lives. F_shape is about whether the distribution has a central tendency at all. The reason this matters is that almost every public model of the AI capex cycle, from Goldman to UBS to the bear letters, assumes the answer to that question is yes, and proceeds from there to argue about which side of the central tendency to bet on.
The answer to that question, I will show, is no.
The pattern is already in the data
Most posts on the AI bubble open with a forecast. I want to open with a fact. Take a representative cohort of twenty-five publicly traded AI-pure-play and AI-exposed equities, spanning frontier-LLM infrastructure, hyperscaler chip exposure, AI software, and AI-power. Measure the trailing twelve-month total return for each name from the start of 2025 to early 2026. Plot the distribution.
The distribution has two clusters. A winner cluster of twelve names with a median return near plus 122 percent. A loser cluster of nine names with a median near minus 42 percent. A middle of four names. The middle is the smallest of the three groups by count, and by probability density it is essentially flat.
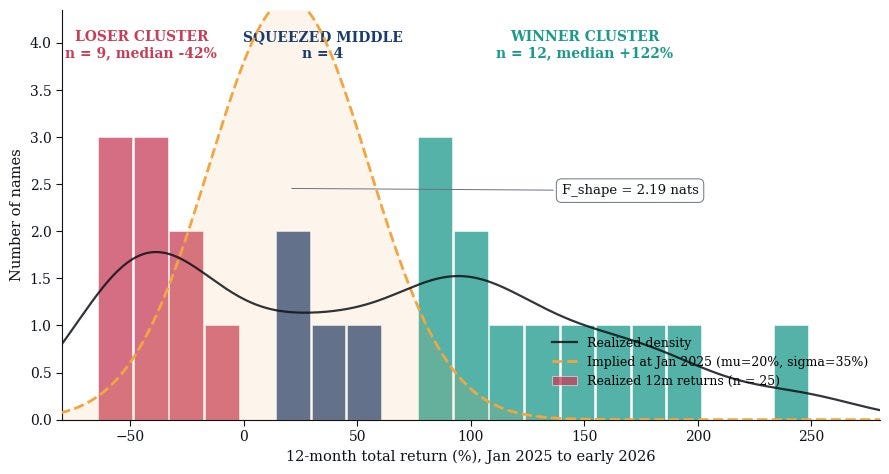
At the start of the same period, the implied 12-month return distribution for the AI basket, reconstructed from option pricing on AI-exposed indices, was Gaussian with a mean near plus 20 percent and a standard deviation near 35 percent. The implied distribution had no clusters. It had one central tendency.
The Kullback-Leibler divergence between the realized distribution and the implied distribution is about 2.2 nats. That number is large. To give it a unit-free interpretation: a KL divergence of 2.2 nats means that an investor who held a portfolio sized to the implied distribution would have been misallocating capital to the tune of approximately e^2.2, or about a factor of nine, between the bins where she was overweight and the bins where she was underweight.
This is not a forecasting failure. It is a shape-recognition failure. The market priced a Gaussian. The world delivered a barbell. And the barbell did not arrive as a tail event. It arrived as the structure of the realization.
The thermometer
There is one line in the AI capex chart that does not require interpretation. Hyperscaler capital expenditure has roughly quadrupled since 2023, with combined Microsoft, Alphabet, Amazon, and Meta capex moving from approximately $135 billion in 2023 to over $545 billion in 2026 [1]. Nvidia’s data-center revenue has tracked it almost exactly, like two pendulums tied to the same beam.
The bull case for Nvidia at $4.4 trillion is a thesis about that line. The bear case for Nvidia at $4.4 trillion is also a thesis about that line. The two cases agree on every observable. They disagree on a single counterfactual: whether the line keeps going.
Andreessen, in his 2023 Techno-Optimist Manifesto [2], framed the buildout as part of an industrial transformation comparable to electrification. Roubini, until late 2025, called it the largest capex misallocation since the Japanese real estate bubble; he has since revised that view [3], arguing that AI productivity tailwinds dominate the policy noise, which is itself an instructive data point about how much sentiment can move on the same observables. Both positions are theses about the same line, in different directions.
What both miss, I think, is that Nvidia is not the asset. Nvidia is the thermometer. It reads the temperature of a system that has at least four thermostats none of which are mechanically connected to the chip cycle. The thermostats are, in rough order of how much I trust the people who control them: Microsoft’s enterprise sales team, OpenAI’s CFO, the credit committee at Blackstone, and the depreciation policy footnote on Amazon’s 10-K.
The gap and what it implies
The simplest version of the gap argument was published in June 2024 by David Cahn at Sequoia, in a piece called “AI’s $600B Question” [4]. Cahn took Nvidia’s data-center run-rate revenue forecast, doubled it to capture total infrastructure cost (energy, buildings, networking), and doubled it again to reflect the gross-margin requirements of end users. The arithmetic produced a $600 billion annual revenue gap between the AI infrastructure being built and the revenue required to justify it. By late 2025, after another doubling of capex, that gap had not closed. It had widened.
I want to be careful about Cahn’s framing. The doublings are heuristic, not rigorous. What is rigorous is the direction of the gap and its persistence under every revision since 2023. Strip out everything except frontier-LLM economics. Set aside computer vision. Set aside AlphaFold. Set aside robotics RL. Set aside recommendation systems and ad-ranking models. Those are real businesses with real margins, and they are not what people are asking when they ask whether AI is a bubble.
What is left, when you strip those out, is a small set of products: ChatGPT, Claude, Gemini, Copilot, and the API revenues that flow under them. Add up the most generous public projections for those products through 2027 [5]. Cumulative revenue across all of them lands near $245 billion. Add up the cumulative capex committed by hyperscalers to the infrastructure that runs those products, scaled for the AI portion (about 75 percent of total capex) and again for the LLM portion (about 70 percent of AI capex). The number lands near $960 billion. The gap at year-end 2027 is approximately $720 billion.
Mauboussin’s wall
In February 2026, Michael Mauboussin published “Bayes and Base Rates: How History Can Guide Our Assessment of the Future” through Morgan Stanley’s Counterpoint Global Insights series [6]. He followed it with a long-form podcast conversation with Kai Wu in March 2026 on the launch episode of The Intangible Economy [7]. The argument is simple and its consequences are enormous.
When OpenAI projects $145 billion in 2029 revenue, starting from $3.7 billion in 2024, that is a five-year compound annual growth rate of approximately 108 percent. When Anthropic’s trajectory is extrapolated to its own internal targets, the number lands in similar territory. Mauboussin’s question is the only question that matters. How often, in the empirical record of capitalism since 1950, has a firm starting above $1 billion in annual revenue sustained that growth rate for five years?
The answer is zero. Not rare. Not in the right tail. Zero. Mauboussin’s sample of nearly eighteen thousand firm-period observations of U.S. public companies starting with $2 to $5 billion in revenue, drawn from Compustat and FactSet, contains no firm that has compounded at one hundred percent or more for five years. None. The empirical maximum is in the neighborhood of 55 to 60 percent. The 99th percentile is around 36 percent.
Brynjolfsson and Acemoglu are the same argument
Two economists have been cited so often in the AI capex debate that their names have become shorthand for opposite positions. This is unfair to both of them.
Erik Brynjolfsson’s Productivity J-Curve, formalized in a 2021 American Economic Journal paper with Daniel Rock and Chad Syverson [9], is not a bull thesis. It is a thesis about delay. When a general-purpose technology arrives, productivity does not rise immediately. It falls. The fall happens because the firms that adopt the technology spend years restructuring their internal architectures around it, and the restructuring costs show up in the data before the gains do. Then the curve turns. The famous case is electrification: factories that bought electric motors in 1900 saw negligible gains because they kept the steam-era factory layout. The gains arrived in the 1920s, when factories were redesigned around what cheap electricity made possible.
Brynjolfsson’s argument is that AI is at the bottom of the J. He may well be right. But the point of his argument is not that the J is guaranteed. The point is that the gains, if they arrive, arrive on a timescale that is measured in factory redesigns, not in product launches. His own work has emphasized that adoption lags capability by something between five and fifteen years. Five years from late 2022 puts us at late 2027. Fifteen years puts us at late 2037. The capex bills come due on a faster clock than that.
Daron Acemoglu’s argument is the harder one. In “The Simple Macroeconomics of AI” [10], he estimates that the productivity gains from AI over the next decade will be, at most, a 0.66 to 0.71 percent increase in total factor productivity, cumulative over ten years. He further argues that this is likely an overestimate, and that more realistic numbers fall below 0.55 percent. The mechanism is that AI improves a narrow set of tasks within a narrow set of jobs, and the share of GDP exposed to those tasks is small. Most of the economy is not knowledge work. Most knowledge work is not what current LLMs do well. Most of the tasks LLMs do well are bottlenecked by tasks they do badly. He calls this the productivity ceiling, and he argues it bites hard at the level of effective enterprise penetration we are currently observing.
Brynjolfsson and Acemoglu are not opposing each other. They are describing two phases of a single dynamical system. Acemoglu describes the system in the regime where adoption stalls below the productivity ceiling. Brynjolfsson describes the system in the regime where adoption breaks through the ceiling, after which the dynamics change qualitatively. The two regimes are separated by a saddle in the system’s phase space. Trajectories that pass through the saddle leave it on one side or the other. They do not stay near it.
The simulation
Let r(t) be cumulative monetizable frontier-LLM revenue. Let c(t) be cumulative committed capex on the supporting infrastructure. Let s(t) be a dimensionless credit-stress variable bounded between zero and one, representing the fraction of capex commitments at risk of repricing or default. Then the system has three coupled equations.
Revenue evolves under logistic growth toward a ceiling K, with stress acting as a multiplicative drag on growth. Capex evolves at a committed nominal rate, attenuated by stress when stress is high (representing project cancellations and SPV restructurings). Stress evolves endogenously: it amplifies when the realized capex-to-revenue ratio exceeds a threshold theta, and it decays otherwise. The ceiling K can switch from a low Acemoglu value K1 to a higher Brynjolfsson value K2 if revenue breaks a threshold within a critical time window, representing the J-curve breakthrough.
The system has a saddle-node bifurcation in s. Below a critical value of c/r, the stable fixed point of s is near zero and revenue grows toward K. Above the critical value, the stable fixed point of s is near one and revenue is crushed. The middle is unstable.
I drew the parameters governing alpha (the revenue compounding rate) from Mauboussin’s empirical lognormal, capped at the empirical maximum sustained CAGR. I drew K1 from a Beta distribution calibrated to Acemoglu’s penetration estimates. I let the J-curve breakthrough fire stochastically with a probability calibrated to the productivity literature. I integrated ten thousand independent realizations forward from late 2025 to the end of 2029 [11].
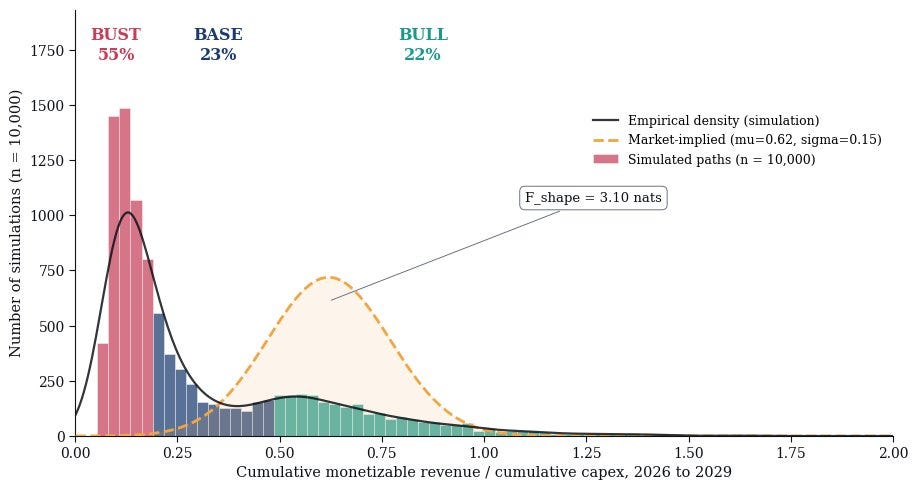
The simulation is built without any prior assumption about the shape of the output distribution. The equations are continuous. The bifurcation emerges from the dynamics.
The result is a two-cluster distribution. About 55 percent of paths land in the bust regime, where cumulative revenue is less than 20 percent of cumulative capex by 2029. About 22 percent of paths land in the bull regime, above 50 percent. The middle, between 20 and 50 percent, holds about 23 percent of paths and is essentially flat in density. The probability density at the implied market-priced ratio of 0.62 is approximately one-fifth of what it would need to be if the system were unimodal.
The orange dashed curve in the figure is the market-implied density, reconstructed from option pricing and consensus models on AI-exposed equities. It is a single Gaussian centered near 0.62 with a standard deviation of about 0.15. The empirical density is what the simulation produces.
The KL divergence between the empirical and the market-implied densities is 3.1 nats. That is F_shape. It is the formal extension of the F framework from Post 2 to the shape of the underlying distribution. F_shape says: the market is not just mispricing the mean of the distribution, it is mispricing the existence of a single mean.
Three nats is a lot. To put it in concrete terms: a portfolio sized for the market-implied density is overweight the empty middle by a factor of approximately twenty, and underweight the bull tail by a factor of approximately five.
The pattern is not new
The argument I have just made will sound, to anyone who lived through the genomics infrastructure cycle of 1999 to 2003, structurally familiar.
In late 1999, capital was piling into sequencing platforms, target discovery infrastructure, and combinatorial chemistry on the thesis that the imminent completion of the Human Genome Project would unlock a wave of drug pipelines, and that whoever owned the picks-and-shovels of genomic discovery would capture the value. The capex cycle was not a bubble in the conventional sense. The technology worked. The platforms were real. The infrastructure was useful. By Q4 2002 the BBH biotech ETF had drawn down 73 percent from peak.
That number is the sector number. It is the index. Look at the cross-section, however, and a different shape emerges
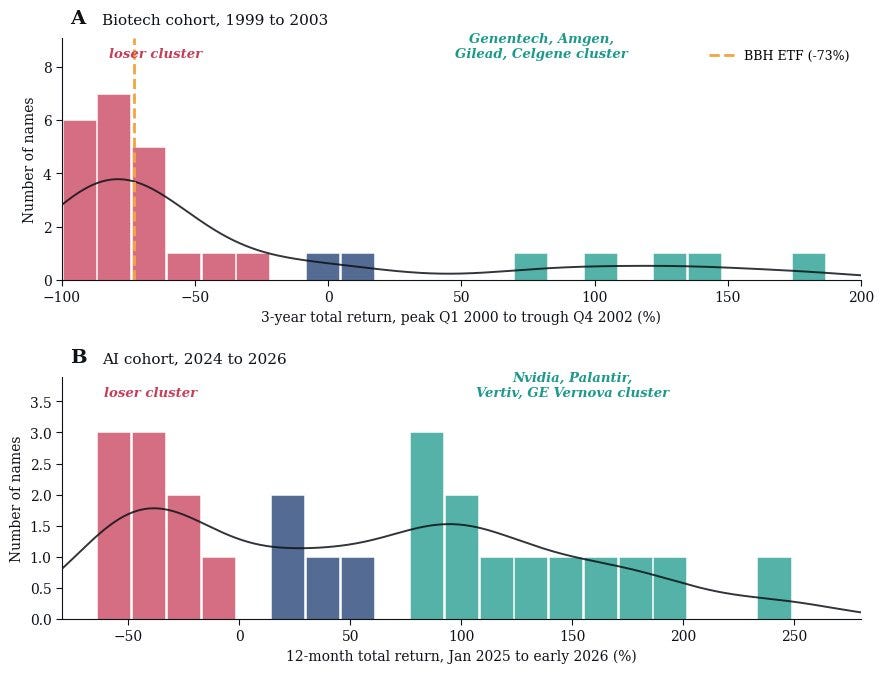
The cross-sectional return distribution for the biotech cohort over 1999 to 2003 was bimodal. A small cluster of names (Genentech, Amgen, Gilead, Celgene) compounded enormously over the same window during which the median name lost most of its market cap. The sector index averaged the two clusters and produced a single number that described neither.
The dispersion was not a tail event. It was the structure of the realization. An investor holding the index lost 73 percent. An investor with the same dollar exposure but a long-short structure that captured the dispersion would have made money over the same period.
The same shape is now visible in the AI cohort. Compare panel A and panel B in the figure above. The clusters are differently positioned, the time horizons are different, the cohorts are different. The shape is the same.
The financial plumbing
If the bifurcation is structural and the market is pricing the empty middle, the question is how the empty middle is being financed. Here is where the post stops being economics and starts being plumbing.
In May 2024, Blackstone led a $7.5 billion debt facility for CoreWeave, secured against the company’s Nvidia GPU inventory [13]. The facility split into investment-grade and speculative-grade tranches, and the customer contracts that backed the tranches were almost entirely with Microsoft, OpenAI, and a handful of other names that, taken together, are the same hyperscaler oligopoly funding the buildout. By early 2026, GPU-collateralized lending across the neocloud sector had crossed $20 billion in outstanding loans, with private credit funds (Blackstone, Apollo, Blue Owl, PIMCO, BlackRock) originating most of it. Morgan Stanley projects an additional $800 billion in private-credit data-center financing over the next two years.
Jeremy Grantham at GMO has argued, in his quarterly letters since 2023, that this cycle follows the textbook bubble pattern, with the difference that the financing is institutional rather than retail. His implication, and I think he is right about this part, is that institutional financing does not make the bubble safer, it makes the unwind slower. Slow unwinds are where careers go to die. The 1990s telecom buildout took eighteen months to peak from the moment of greatest conviction, and four years to fully unwind. AI capex is at month thirty-six of that clock, by my counting.
What’s up next?
Next one takes the macro framework of this post and pushes it down into the firm. The capex-to-monetizable-revenue gap I have drawn at the industry level has a local dual at the firm level: the gap between AI seats sold and AI seats actually used. Microsoft has been disclosing Copilot adoption metrics in a way that suggests, on the most charitable reading, that roughly 30 to 40 percent of seats are not in active use. The gap between sold and used is a microcosm of the gap between capex and revenue. It is the same fidelity gap, refracted through the principal-agent structure of corporate IT procurement. The IT department, the sales rep, and the CFO are running three different optimization problems. The seats are the proxy that mediates among them. The proxy is the bubble.
References
[1] Hyperscaler capex data from public 10-K filings and quarterly earnings releases: Microsoft, Alphabet, Amazon, Meta, fiscal years 2023 through 2026. 2026 figures incorporate management capex guidance from Q1 2026 calls.
[2] Andreessen, M. (2023). The Techno-Optimist Manifesto. Andreessen Horowitz, October 16, 2023.
[3] Roubini, N. (2025). Tech Trumps Tariffs: US Exceptionalism and the AI Productivity Boom. Hudson Bay Capital, November 2025. The shift from his earlier bearish position is the data point: same observables, opposite conclusion.
[4] Cahn, D. (2024). AI’s $600B Question. Sequoia Capital, June 20, 2024. Earlier framing: Cahn, D. (2023). AI’s $200B Question. Sequoia Capital, September 2023.
[5] OpenAI revenue trajectory: Muppidi, S. (2025). “OpenAI Says Its Business Will Burn $115 Billion Through 2029,” The Information, September 5, 2025. Anthropic figures from publicly disclosed run-rate via Series F and G announcements. Google and Microsoft AI-attributed segment revenue from Q1 to Q3 2025 earnings calls.
[6] Mauboussin, M. J. (2026). Bayes and Base Rates: How History Can Guide Our Assessment of the Future. Counterpoint Global Insights, Morgan Stanley Investment Management, February 2026.
[7] Wu, K., & Mauboussin, M. J. (2026). Base Rates, AI Adoption, and Investing in the Intangible Economy. The Intangible Economy podcast, Episode 1, March 31, 2026.
[8] Mauboussin, M. J., & Callahan, D. (2024). The Impact of Intangibles on Base Rates. Counterpoint Global Insights, Morgan Stanley Investment Management.
[9] Brynjolfsson, E., Rock, D., & Syverson, C. (2021). The Productivity J-Curve: How Intangibles Complement General Purpose Technologies. American Economic Journal: Macroeconomics, 13(1), 333-372. Earlier circulation: NBER Working Paper 25148 (2018).
[10] Acemoglu, D. (2024). The Simple Macroeconomics of AI. NBER Working Paper 32487. Published as: Acemoglu, D. (2025). The simple macroeconomics of AI. Economic Policy, 40(121), 13-58.
[11] Simulation code available at github.com/FranzuBaren/Audit-Risk. Includes the dynamical system integration, F_shape calculation, and Hartigan dip test implementation.
[12] Hartigan, J. A., & Hartigan, P. M. (1985). The Dip Test of Unimodality. Annals of Statistics, 13(1), 70-84.
[13] CoreWeave / Blackstone GPU-collateralized debt: press coverage in Financial Times, “Wall Street frenzy creates $11bn debt market for AI groups buying Nvidia chips,” 2024. Updated total private-credit data-center exposure: Man Group, “The AI Bubble: Hidden Risks and Opportunities,” 2025.
[14] Amazon.com Inc. Form 10-K, fiscal year 2024, and Form 10-Q, Q1 2025. Disclosure of useful-life change from six to five years effective January 1, 2025; $920M Q4 2024 accelerated depreciation; $700M projected 2025 operating income reduction.
[15] Burry, M. J. (2025). X (formerly Twitter) thread, November 11, 2025, accusing hyperscalers of $176 billion in understated depreciation 2026-2028. Substantive elaboration: Burry, M. J. (2025-present). Cassandra Unchained. Substack newsletter, launched November 24, 2025.