The Morning After
Adoption never proves the technology... but it proves what organizations can absorb!

Every series has to end somewhere, and the honest place to end this one is not with a verdict but with a question I have circled for five posts without quite asking. Not whether the bubble is real, which it is, nor when it pops, which no one knows. The question is what is left standing in the room after the noise dies down.
So let me start with two numbers.
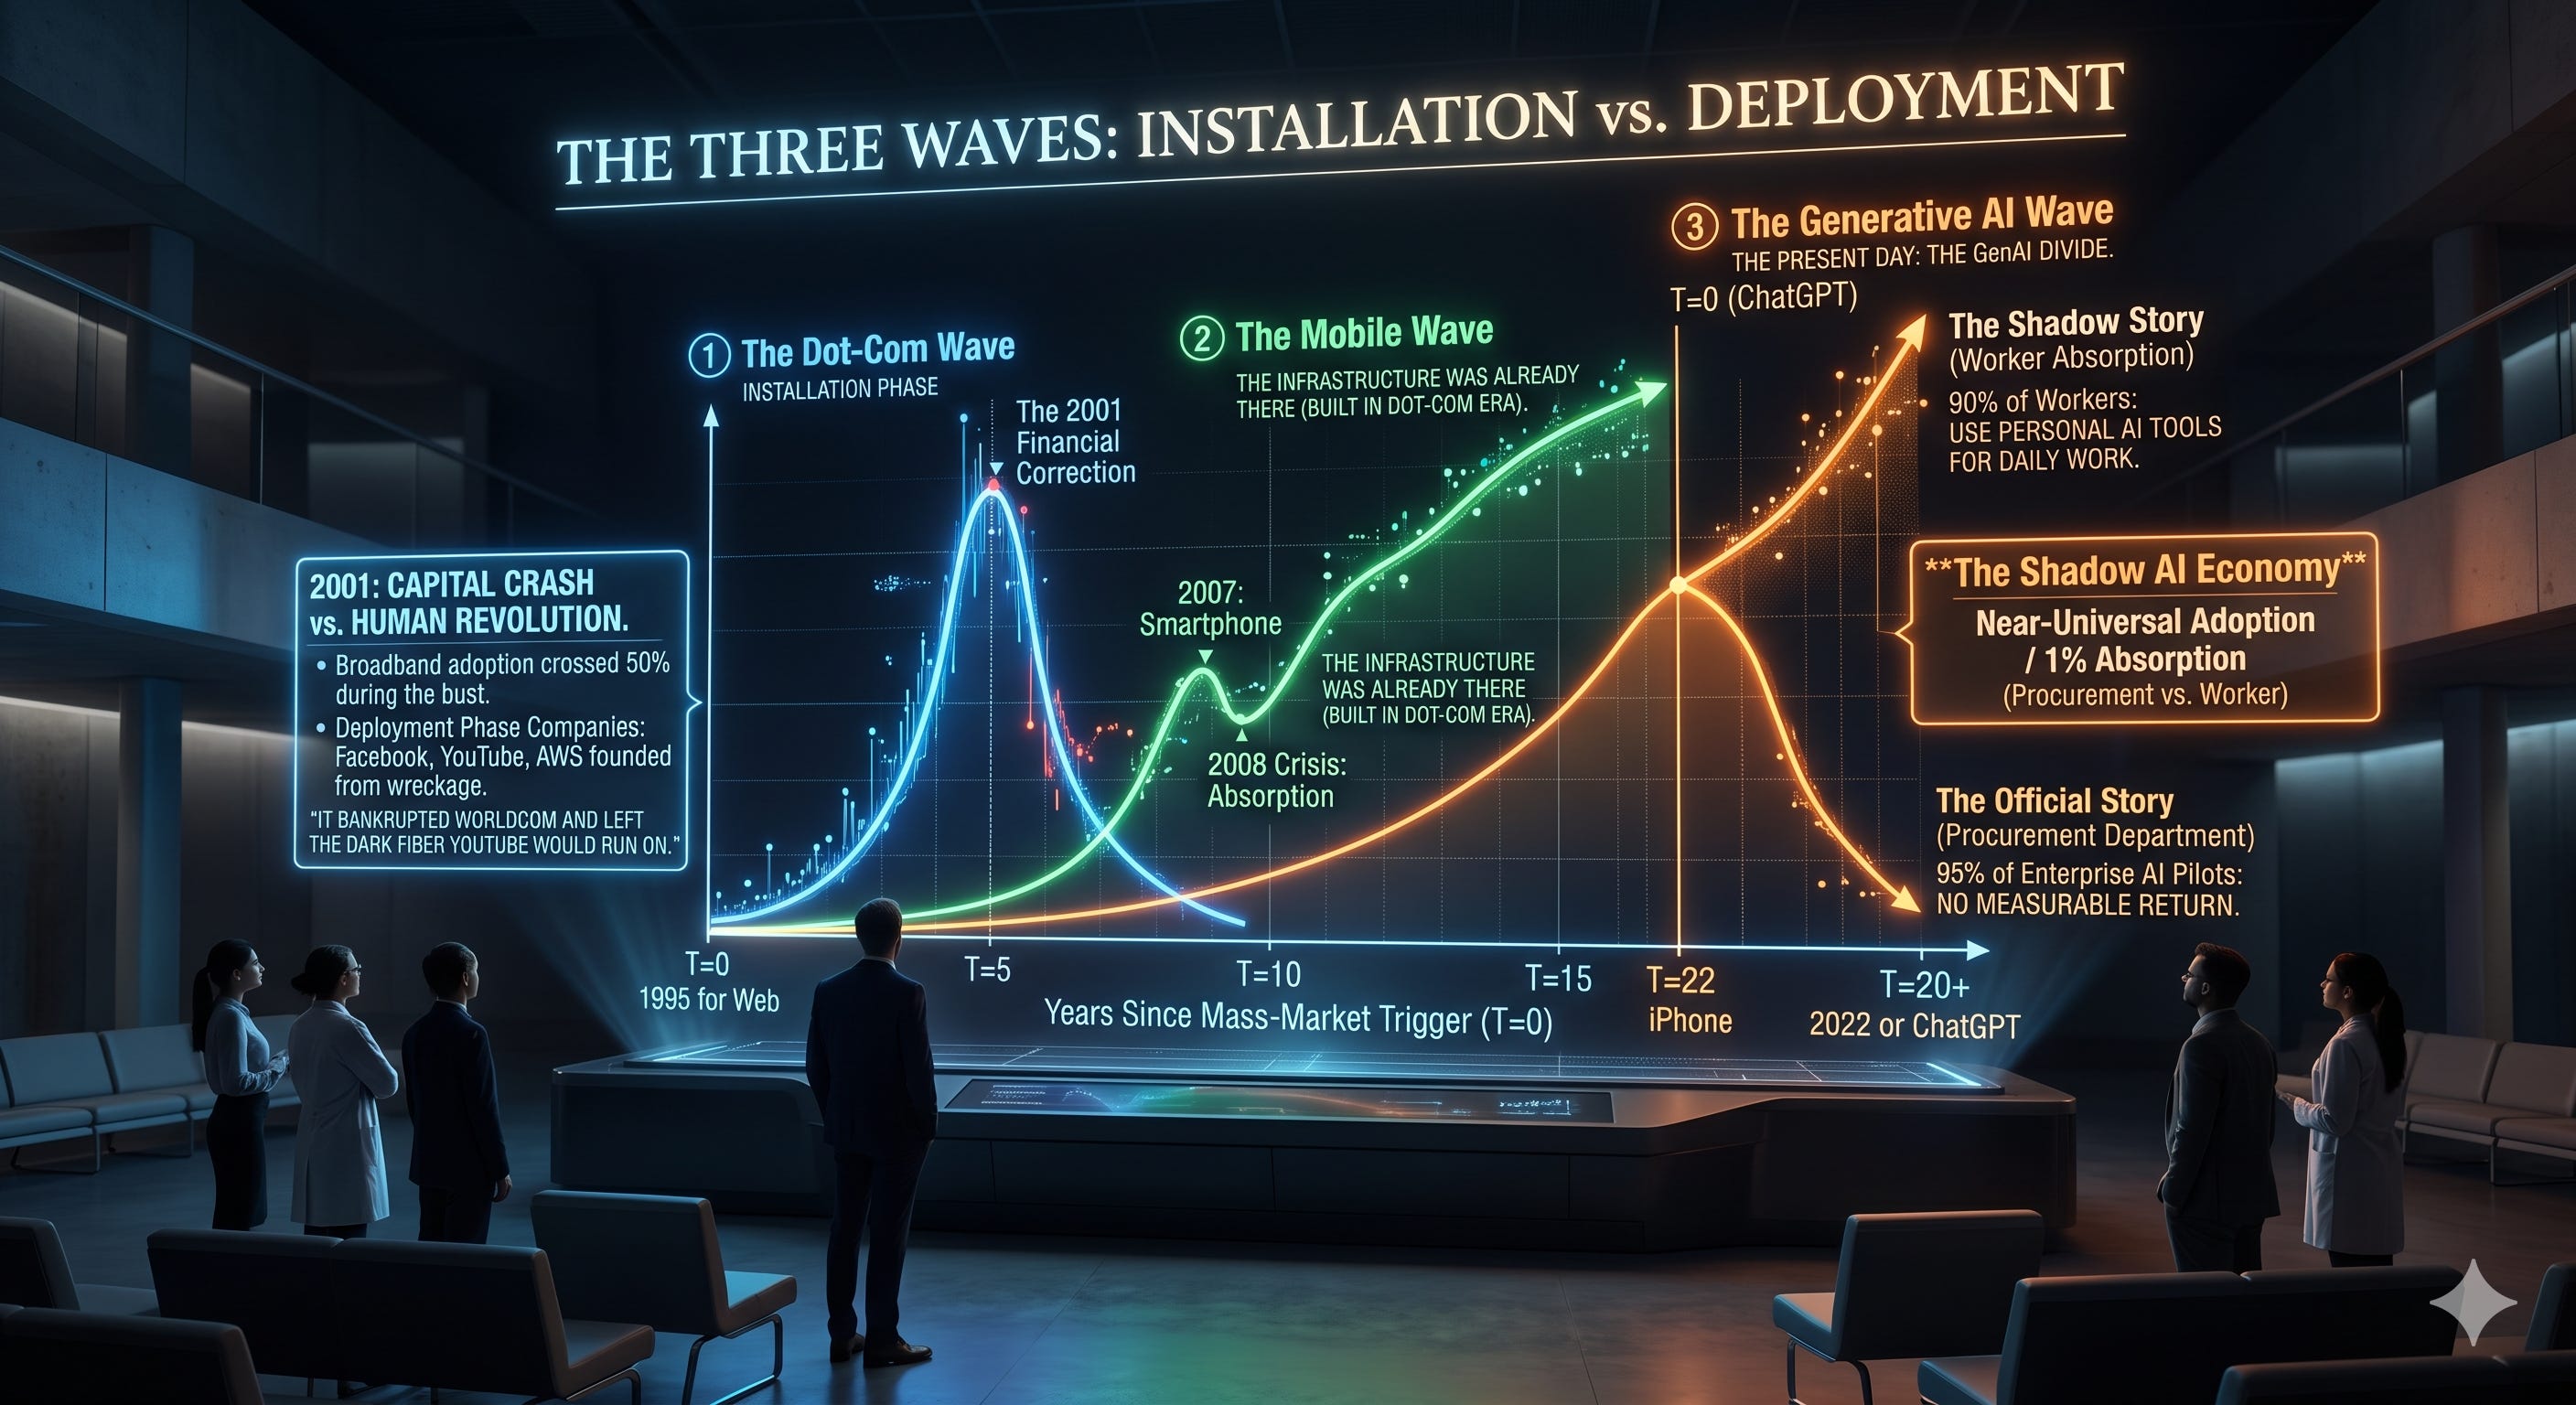
In August 2025, MIT’s Project NANDA published The GenAI Divide: State of AI in Business 2025, built on 300 deployments and dozens of interviews. Its famous finding is brutal: about 95 percent of enterprise generative-AI pilots produced no measurable return. Its second finding, which almost nobody quoted, is the more important one. Only 40 percent of the surveyed companies had bought an official LLM subscription, yet workers at more than 90 percent of them were already using personal AI tools on their own accounts to do daily work. NANDA called it the shadow AI economy. The official projects were failing while the unofficial ones, run by employees on personal credit cards, quietly worked.
Hold that against McKinsey. In its 2025 workplace research, more than three-quarters of organizations use AI in at least one business function, while just 1 percent of leaders call their companies mature, meaning AI is fully woven into workflows and actually drives outcomes. Near-universal adoption. One percent absorption.
That ratio is the whole post. It is the procurement department’s number set against the worker’s number, and the two cannot be reconciled inside the framework procurement uses. The official story measures what was bought. The shadow story measures what was absorbed. Everything that follows takes the distance between them seriously, and gives it a shape, a mechanism, and finally a number.
This is the last of six posts that began from one claim: the AI bubble is not one thing. Post 1 split it into three layers on three clocks. Post 2 named the four assumptions holding the trade up and measured each as a divergence between what the industry claims and what its behaviour reveals. Post 3 ran a Monte Carlo on capex and found the central case already priced in. Post 4 asked whether pharma sat outside the logic and found the exemption real about the clock, illusory about the prices. Post 5 sorted survival by how tightly each business was coupled to a user who keeps paying.
Each resolved a piece. The piece left is the title’s. After the correction, what does the morning look like? Not the headline. The actual texture of work, on actual desks. To get there, look first at two prior mornings the market remembers worse than the nights before them.
The 2001 forensics
The NASDAQ closed at 5,048 in March 2000 and at 1,114 by October 2002. Four-fifths of the index, gone. The bust is remembered as a clean line between the silly era and the serious one. The data tells a stranger story.
In December 1998, 26.2 percent of US households were online. By August 2000, four months after the peak, 41.5 percent. The NASDAQ then fell for two and a half years, and internet adoption rose every year through all of it, crossing fifty percent in September 2001, the month of the most concentrated equity destruction. The trough of the correction coincided almost exactly with the moment most Americans came online.
Two things were happening, and they were not the same thing. The correction was about capital. The adoption curve was about people learning to use the thing. The first got the headlines. The second was the revolution. Between 2001 and 2010, household broadband went from 9 to 68 percent, and the companies built in that window, Facebook, YouTube, AWS, Stripe, mostly did not exist before the correction. Several were founded by people wiped out in it.
This is Carlota Perez’s central finding. Every technological revolution has an installation phase, where speculative capital builds the infrastructure, and a deployment phase, where the infrastructure is absorbed. Between them sits a financial correction. The correction is not a malfunction. It is the transition mechanism. It clears the rent-seekers and frees the substrate the speculative phase financed. It killed Pets.com and freed its engineers; it bankrupted Worldcom and left the dark fiber YouTube would later run on. It did its job. The job took ten years.
The mobile precedent nobody remembers
The iPhone launched in 2007. Eighteen months later the financial crisis hit, and there was no smartphone-specific correction because the wave was small enough to fold into the larger one. But the deployment teaches something.
In 2011, four years in, 35 percent of US adults owned a smartphone; by 2015, 68 percent; by 2025, 91 percent. The curve was steeper than the internet’s and saturated faster, because the infrastructure was already there, the wireless networks built during the dot-com decade, and organizations had spent fifteen years learning to fold connected devices into workflows. The smartphone deployment consumed what the prior wave left behind and finished the build-out the bust had interrupted.
This is what the AI conversation is missing. The question is not what AI does once the correction comes. It is what the AI installation phase leaves behind.
Three curves on a common clock
The chart puts all three waves on one axis: years since each technology’s mass-market trigger, 1995 for the web, 2007 for the iPhone, 2022 for ChatGPT.
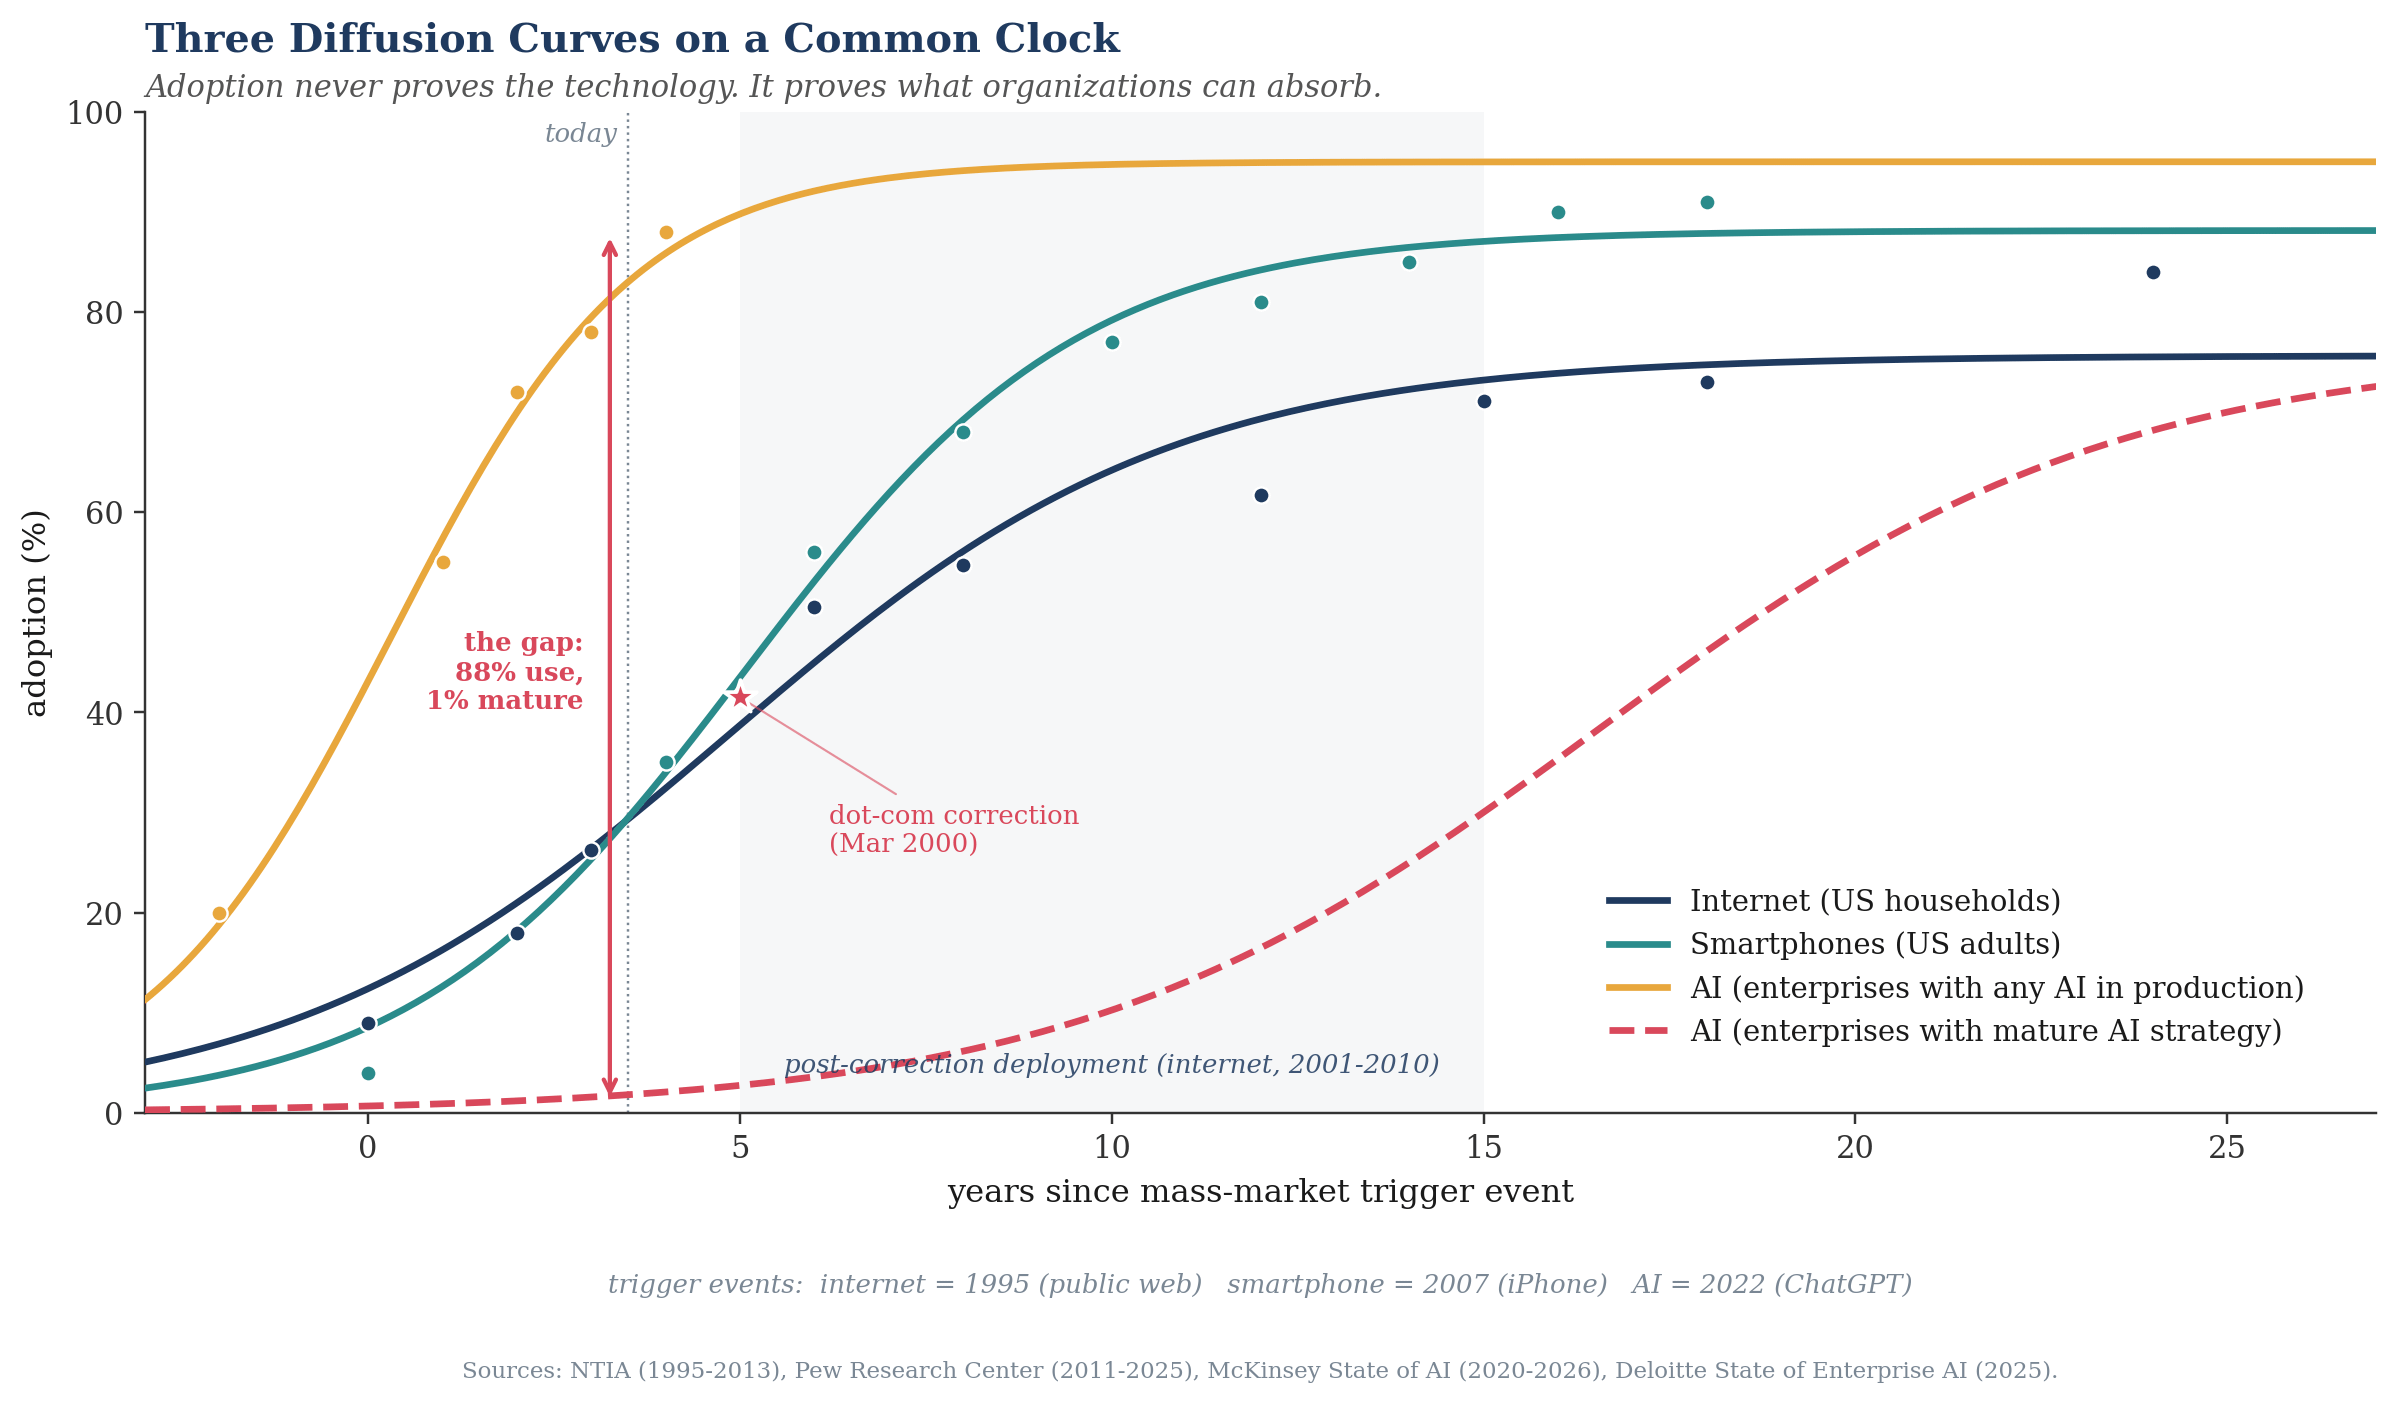
The post-correction internet decade, shaded, is where the real revolution happened. The arrow at “today” marks the gap inside the current AI wave: more than three-quarters of enterprises use AI, roughly 1 percent are mature.
Two observations. First, the AI broad-use curve is the steepest of the three, faster than internet or smartphone by a wide margin. This is the number quoted to argue the AI wave is different in kind. The steepness is real. What it measures is not what most readers think.
Second, the curve for mature deployment sits almost flat against the floor. The two measure different things. Broad use means the organization touched AI in some function: a survey response. Maturity means AI is wired into a production workflow with real value capture and governance: the actual revolution. The internet and smartphone curves have no equivalent gap, because the technology was self-contained at the point of adoption. You bought the phone, you owned the phone, you used the phone. AI is different. The point of adoption is the start of a long stack of work, not the end. The model is procured in a quarter. The integration takes a decade.
Where the gap lives
The adoption-to-maturity gap has a structure.
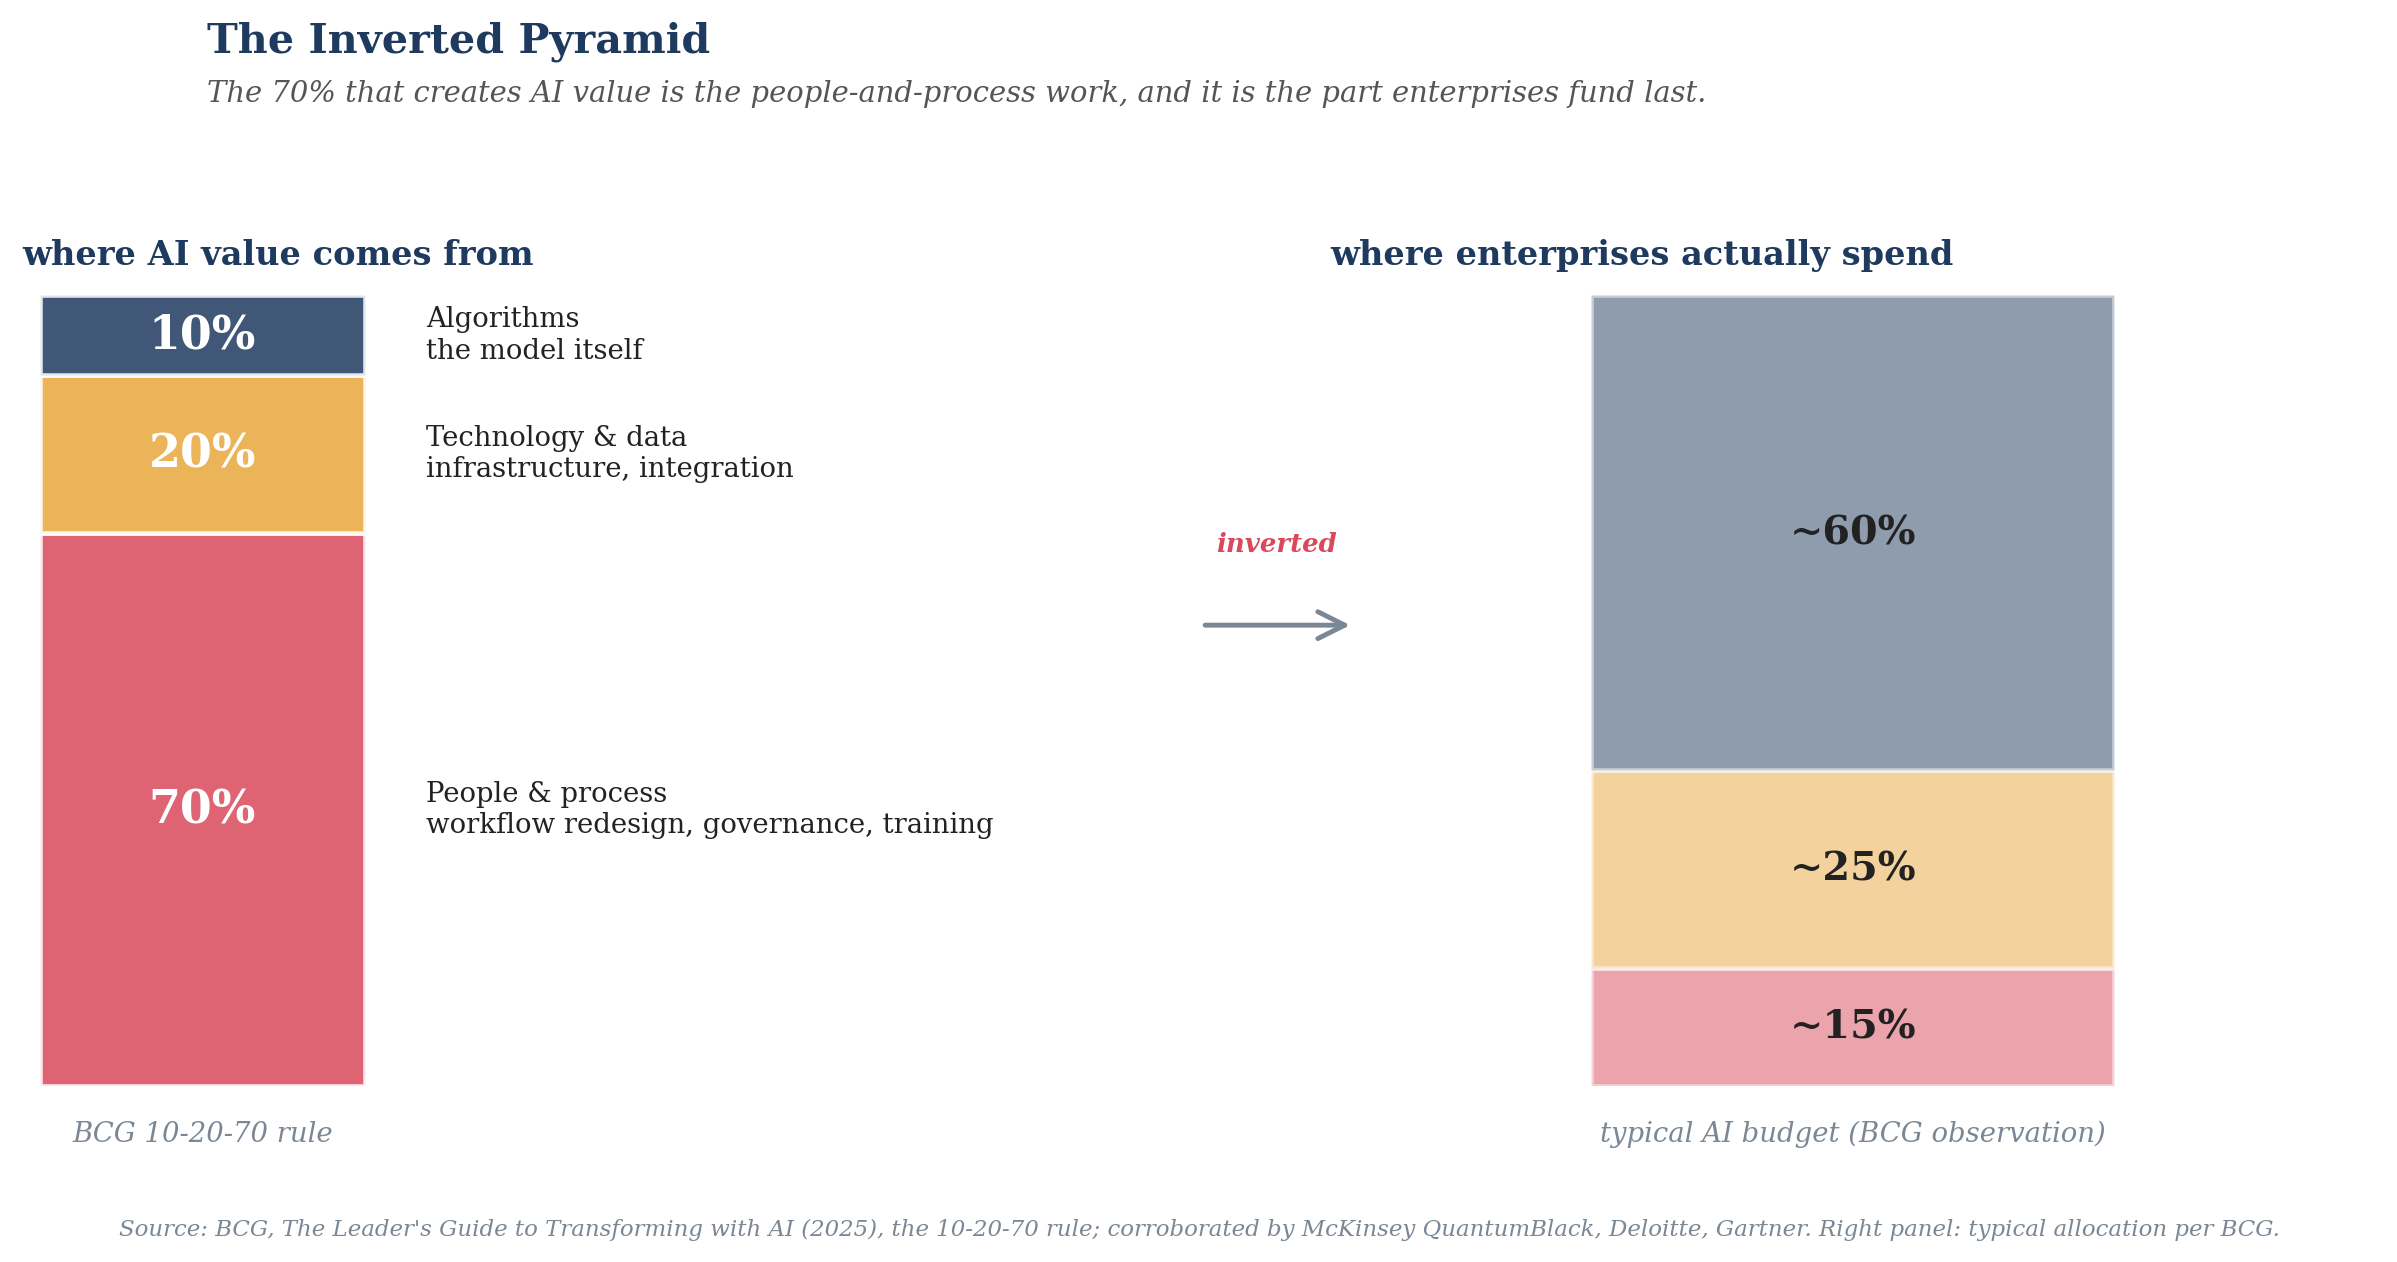
The finding is BCG’s, corroborated by McKinsey QuantumBlack, Deloitte, and Gartner. Most enterprises invert it, spending the majority on the algorithm-and-infrastructure tip. The 70 percent that creates the value is the part funded last, and it is exactly the absorptive-capacity work.
The number that matters is the 70 percent. The algorithm everyone argues about is a tenth of what determines whether AI creates value. The rest is people and process, and it is slow for a reason that has nothing to do with technology. Governance is slow because someone has to decide who is accountable when the model is wrong, a question of institutional design, not transformer architecture. Skill is slow because people have to learn when to trust the tool and when to override it. None of this speeds up when the next model ships. Some of it gets harder.
The timelines bear this out. Across Gartner, McKinsey, and Deloitte surveys the pattern converges: a first pilot reaches production in three to six months, function-level deployment takes twelve to eighteen, and enterprise-wide transformation runs twenty-four to thirty-six. Deloitte’s 2026 enterprise survey states it plainly: the technology is no longer the bottleneck; the bottleneck is organizational readiness. The internet deployment took ten years and mobile took eight. AI, on the 70 percent that actually matters, looks more like fifteen.
The fourth temporal layer
Post 1 named three layers on three clocks: narrative in months, applications in years, infrastructure in decades. The NANDA finding points at a fourth.
Call it the shadow-adoption layer, the gap between what the organization procured and what its workers actually use. Its clock is the fastest of the four, the time it takes to type a credit-card number into a billing page, and also the slowest, because what a worker does on a personal account never metabolises into organizational capability. It is productivity without governance, without auditability, without institutional learning.
The Copilot data is its signature. Microsoft disclosed 15 million paid Copilot seats in its January 2026 earnings, about 3.3 percent of its 450 million commercial base. Recon Analytics, surveying more than 150,000 US workers that same month, found that only 35.8 percent of employees with access actively used Copilot, against 83.1 percent for ChatGPT. Where workers had a real choice, the gap widened: given both tools, 18 percent chose Copilot and 76 percent ChatGPT, and with all three major platforms available Copilot’s share fell to 8 percent. Only when it was the sole option did usage reach 68 percent. The seats are revenue on the statements that feed the monetisation narrative; the usage is attention flowing to whichever model the worker prefers. The shadow layer is where the two reconcile, and it is not benign: Menlo Security found most employees using personal AI accounts and entering company data into them, and IBM’s 2025 breach report put the premium on a shadow-AI-linked breach at $670,000.
This is where the morning after starts. Section II asked what the installation phase leaves behind. Part is the compute. The less obvious part is in the NANDA data: a workforce that taught itself to work with frontier models, off the books, years before its employers’ programs reached it. Tens of millions of people who already did their own share of the 70 percent, the skill and workflow learning that Figure 2 shows is most of the work, without permission or budget. When the deployment phase arrives, it does not start from zero. It starts from the browser tabs.
The gap has a number
The gap can be measured, which turns a rhetorical contrast into something others can recompute and track.
McKinsey reports the two figures together: more than three-quarters adoption, 1 percent maturity. The adoption number invites you to read it as the probability that a random enterprise has operationalized AI. The maturity number says the real probability is 1 percent. These are deliberately different constructs, and the distance between them is where the narrative does its work, letting the first stand in for the second. The absorptive-capacity gap A measures that distance: the Kullback-Leibler divergence between the readiness the adoption number implies and the readiness the maturity number reveals, the same construction Post 2 used for the fidelity gap F.
On McKinsey’s within-report pairing, 75 against 1 percent, A is about 2.9 nats. The higher adoption figure from the late-2025 State of AI survey lifts it toward 3.7. Push every input to its most charitable reading, 75 percent against a generous 5 percent maturity, and A is still 1.7. Post 2’s entire four-assumption fidelity stack came to about 1.0 nat. Under every reading, A exceeds F.
The honest objection is that A is partly a definition: choose different survey items and you get a different number. True, and that is the point. A is only as sound as the pairing it rests on, so the pairing must be one the source itself treats as a single finding. McKinsey reporting three-quarters adoption and one percent maturity as a single paradox is exactly that. The number inherits its authority from theirs.
What it then says is worth sitting with. The largest measured divergence in this bubble is not in the market’s story about the technology. It is inside the organizations, between what they adopted and what they absorbed. The market is wrong about the technology by about a nat. The org charts are wrong about themselves by three.
The fork
We can now say what the morning looks like, with a mechanism behind it.
The correction will not produce a crash and a slow recovery. It will produce a fork. One branch atrophies; the other slowly fills out the absorptive-capacity stack and becomes the revolution.
The atrophying branch is the chatbot monoculture: the wrappers, the prompt-engineering startups, the assistants that promised to be everything and delivered a faster way to write email. Loosely coupled to user value, easily substituted by the labs that supply them, tied to the narrative layer. When narrative confidence breaks, this breaks with it, and most of the headline dollar destruction happens here.
The surviving branch has been doing the slow work all along: pharma’s drug-discovery pipelines, AI-assisted code generation in real engineering orgs, clinical decision support, defect detection, fraud detection, document extraction in audit and legal. None of it reaches a magazine cover. All of it compounds through the decade. What unifies it is not technical sophistication, since both branches often run the same models. It is that the surviving branch always worked on the absorptive-capacity clock. Its work was never the model. The model was an input; the system was the product.
Pharma is the proof case, for a reason rarely given. The usual story is that biology is a data problem. The real story is that decades of regulation forced pharma to build the absorptive-capacity stack before AI arrived: validated systems, audit trails, accountability for algorithmic decisions, documented model lifecycles, the governance and process work that is 70 percent of the job, already muscle memory in any firm that survived an inspection. The 10-20-70 rule is, if anything, more pronounced in life sciences, because regulated environments multiply the change-management surface. Post 4 found pharma’s exemption half real. This is the half that was real. The slow clock the market prices as a liability is exactly what made pharma the first large-scale absorber. The supposed laggard had a twenty-year head start on the only work that matters.
This also resolves a thread left open in Post 5, which named five survival archetypes and then a sixth, the governance suppliers born from the correction. Figure 2 is why they exist. If 70 percent of AI value lives in people and process, the firms that compress that work, the validation toolmakers, drift-detection vendors, assurance frameworks, audit-grade observability layers, sell the scarcest input of the decade. The picks and shovels of installation were GPUs. The picks and shovels of deployment are instruments of absorption.
This is what Yann LeCun has argued for years. His position reads as a research disagreement about whether LLMs reach general intelligence; it is really a deployment-shape argument in disguise. Intelligence grounded in a specific context and specialized for a domain is what works. Intelligence that is general, disembodied, and consumed through a chat box does the narrow thing and fails the integration job. The evidence is not in the benchmarks. It is in the gap between adoption and absorption.
The countervailing vision is Ilya Sutskever’s: build one thing and scale it as far as it goes. The product that implies is the model itself, sold as a service, applied to whatever the user needs, on a bet that capability eventually becomes so general the absorptive-capacity stack collapses, the model doing its own integration and governance. Internally coherent, perhaps right on a long horizon, but it has no deployment story for the next decade, which is the decade the gap actually gets metabolised. Sutskever’s vision is the LLM as product. LeCun’s is the LLM as component. The morning after is when the market reprices that distinction, not because the research is settled but because the deployment evidence has piled up for three years and the gap has refused to close at the rate the product-shape needs. LeCun bets on it with his career, leaving Meta in late 2025 to build world-model systems. He may be wrong about the architecture and still right about the shape.
Two witnesses
A mechanism only its author believes is a preference with equations. Two thinkers, neither of whom would phrase it as I have, frame the same clock from opposite ends.
Carlota Perez supplies the beginning. The post-correction decade, not the boom, is when a technology’s impact lands, and whether it lands depends on institutional rewiring, not on the technology. The dot-com correction produced the internet decade because regulators, schools, and firms slowly learned what the web was for. The AI analogue is a choice societies make, not a property the models have.
Azeem Azhar supplies the verb. AI transforms knowledge work, he wrote in late 2025, only after firms pair it with the institutional rewiring needed to “metabolise” it. Organizations digest technology slowly because organisms digest slowly. No inference-time trick makes a governance committee faster.
Between the frame and the verb sit the working researchers, who disagree productively about how the decade is spent. Andrej Karpathy calls this the decade of agents, not the year, with a timeline five to ten times slower than the prevailing optimism, and still thinks the path is LLM-based. Yann LeCun thinks the architecture itself must change. Stuart Russell, from the safety side, argues the AI worth deploying is the AI whose behaviour can be bounded, which favours the embedded system over the raw model. They disagree about the chassis. They agree about the shape: what survives is grounded, specialized, embedded, and slow to absorb. That agreement, across people who agree on little else, is the closest thing to external validation a structural argument can have.
The bet, updated
Post 1 made four falsifiable predictions. With Posts 2 through 5 in the record, they can be tightened.
The narrative layer has deflated on schedule. By mid-2027 the dominant frame will shift from “AI is overhyped” to “AI is taking longer than promised,” a different and more accurate complaint. The application shakeout is on schedule too: the February 2026 software selloff that erased roughly a trillion dollars in five sessions, triggered by Anthropic’s Cowork release, was an early repricing of the wrapper layer, and Post 1’s 60-70 percent mortality estimate for 2023-2024 vintage AI startups now looks conservative; I would put it at 65-80 percent by 2027-2028. The infrastructure call I would adjust most: hyperscaler capex likely plateaus earlier than my original 2028-2029, perhaps late 2027, with Microsoft’s coming earnings the first signal to watch. The productivity payoff has the longest clock and will be back-loaded relative to capex: disappointment in 2027-2028, then a bump in 2030-2035 that the same commentators will call inevitable.
To these four I add a fifth, in this post’s own object. A is recomputable from any survey publishing both an adoption and a maturity share, and McKinsey publishes both. Today A sits between 2.9 and 3.7 nats. If the absorption thesis is right, deployment work should pull maturity toward 10 percent by the 2029 survey wave, dropping A below 2.0 nats. So the bet: A falls below 2.0 nats by the 2029 wave. If 2029 still shows maturity below 5 percent, A stays above 2.5, the absorption is not happening on the deployment clock, and the morning after is longer and darker than I have argued. The thesis carries its own thermometer, and it can be read against me.
This closes the AI Hype Bubble series. Six posts, one object, one bet now on the clock. The next series will measure something else the same way.
Posts in this series:
Post 1, The Bubble That Isn’t (And Is).
Post 5, Everyone Survives the Correction. Post 6, The Morning After (this post).
If this post engaged you, the Audit 2.0 series from Q1 2026 develops the underlying machinery for measuring drift in organizational systems. The drift-velocity framework that closed Audit 2.0 is the same shape of object as the absorptive-capacity gap that closed this series.